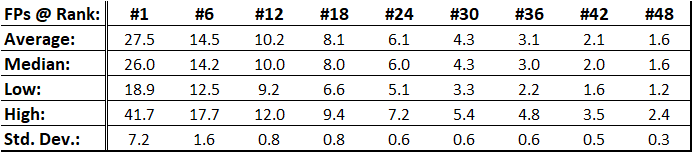
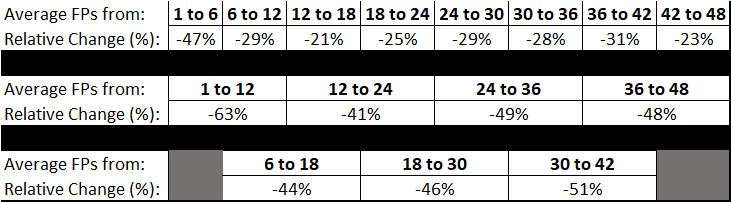
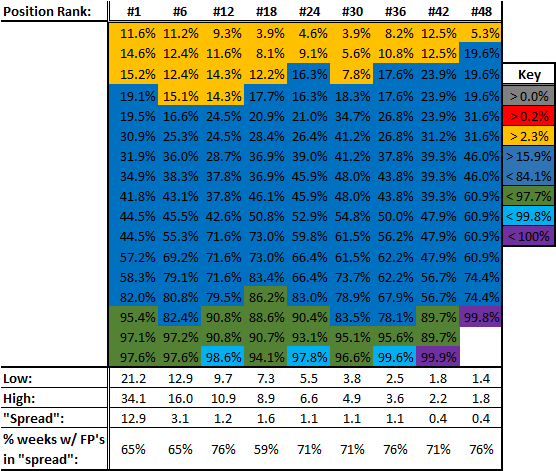
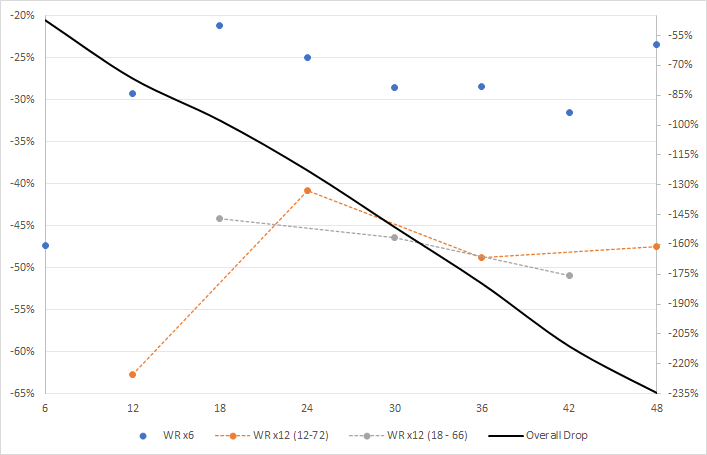
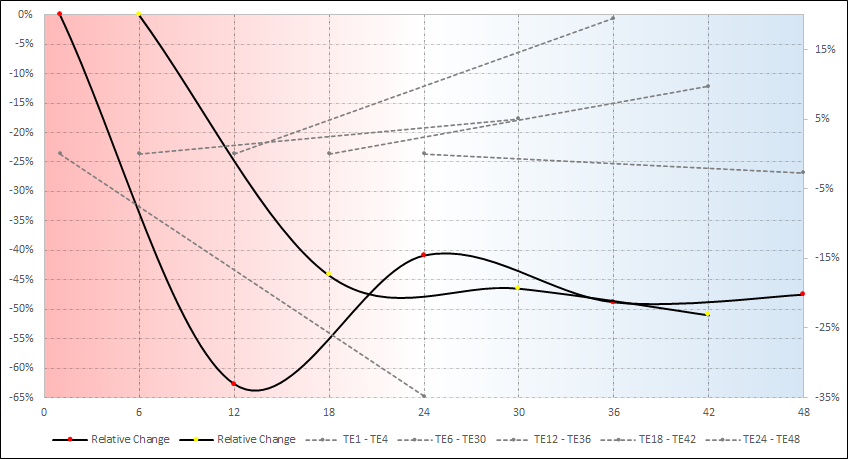
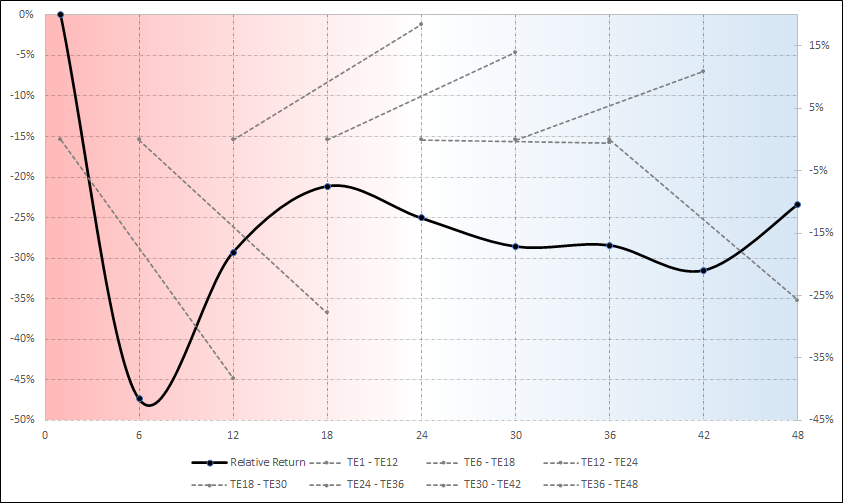
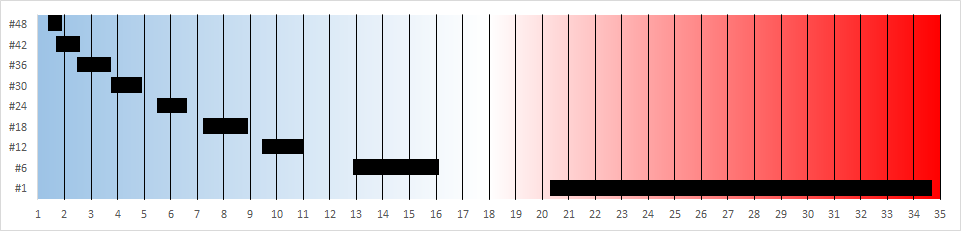
As I recall, in comparison to tight ends in half-ppr scoring, there is less of an advantage across the top several tight ends and more diversity among the (“good”) back-end starters / flex players. Meaning overall the value at the top drops by a bit, through the middle increases, and then drops yet again; in comparison to half-ppr scoring.
There is a higher ceiling/floor too which one could assume would increase the positions value against K’s, D/ST’s, QB’s & RB’s (the most / WR’s the least) to varying degrees.
In the future I’ll go into more detail, my apologies – everything has taken longer than expected (getting up and running).